Technical introduction to the AF Method
The Alkire-Foster (AF) Method developed by Sabina Alkire and James Foster offers an intuitive approach to the measurement of intrinsically multidimensional concepts including poverty, wellbeing, vulnerability and empowerment.
The first 6 steps are common to many multidimensional poverty measures, the remainder are specific to the AF method.
Step 1: Choose Unit of Analysis. The unit of analysis is most commonly an individual or household but could also be a community, school, clinic, firm, district, or other unit.
Step 2: Choose Dimensions. Most researchers implicitly draw on five means of selection, either alone or in combination. These influence the choice of dimensions, indicators, cutoffs and weights. These are as follows:
- Ongoing deliberative participatory exercises that elicit the values and perspectives of stakeholders. A variation of this method is to use survey data on people’s perceived necessities.
- A list that has achieved a degree of legitimacy through public consensus, such as the universal declaration of human rights, the SDGs, or similar lists at national and local levels.
- Implicit or explicit assumptions about what people do value or should value. At times these assumptions are the informed guesses of the researcher; in other situations they are drawn from convention, social or psychological theory, or philosophy.
- Convenience or a convention that is taken to be authoritative or used because these are the only data available that have the required characteristics.
- Empirical evidence regarding people’s values, data on consumer preferences and behaviours, or studies of what values are most conducive to people’s mental health or social benefit.
Clearly these processes overlap and are often used in tandem empirically; for example, nearly all exercises need to consider data availability or data issues, and often participation, or at least consensus, is required to give the dimensions public legitimacy.
Step 3: Choose Indicators. Indicators are chosen for each dimension on the principles of accuracy (using as many indicators as necessary so that analysis can properly guide policy) and parsimony (using as few indicators as possible to ensure ease of analysis for policy purposes and transparency). Statistical properties are often relevant—for example, when possible and reasonable, it is best to choose indicators that are not highly correlated.
Step 4: Set Deprivation Cut-Off. A deprivation cutoff is set for each indicator. This step establishes the first cutoff in the methodology. Every person can then be identified as deprived or non-deprived with respect to each indicator. For example, if the dimension is schooling (‘How many years of schooling have you completed?’), ‘6 years or more’ might identify non-deprivation, while ‘1–5 years’ might identify deprivation in the indicator. Poverty thresholds can be tested for robustness, or multiple sets of thresholds can be used to clarify explicitly different categories of the poor (such as deprived and extremely deprived).
Step 5: Apply Poverty Lines. This step replaces the person’s achievement with their status with respect to each cutoff; for example, in the dimension of health, when the indicators are ‘access to health clinic’ and ‘self-reported morbidity body mass index,’ people are identified as being deprived or non-deprived for each indicator.
The process is repeated for all indicators for all other dimensions. Table 1 provides an example for a group of four people. ND indicates that the person is not deprived (in other words, their value in that indicator is equal or higher than the cutoff), and D indicates that the person is deprived (their value is lower than the cutoff).
Step 6: Count the Number of Deprivations for Each Person. This step is demonstrated in the last column of Table 1. In the Table 1 example, we assign the indicators equal weights. Please note that the equal weighting of indicators is not the only option. Different weights can be assigned to indicators when using the AF method. In those cases, the weighted sum is calculated.
Step 7: Set the Second Cutoff, k. This gives the number of indicators in which a person must be deprived in order to be considered multidimensionally poor. In practice, it may be useful to calculate the measure for several values of k. Robustness checks can be performed across all values of k. In the example in Table 1, k is set to 4 and the persons whose data are shaded are identified as poor.
Step 8: Apply Cutoff, k, to Obtain the Set of Poor Persons and Censor All Non-poor Data. The focus is now on the profile of the poor and the dimensions in which they are deprived. All information on the non-poor is replaced with zeros (0). This step is shown in Table 2.
Step 9: Calculate the Headcount, H. Divide the number of poor people by the total number of people. In our example, when k = 4, the headcount is merely the proportion of people who are poor in at least 4 of indicators. For example, as seen in Tables 1 and 2, two of the four people were identified as poor, so H = 2/4 = 50 per cent. The multidimensional headcount is a useful measure, but it does not increase if poor people become more deprived, nor can it be broken down by dimension to analyse how poverty differs among groups. For that reason, we need additional measures.
Step 10: Calculate the Intensity, A. A is the average number of deprivations a poor person suffers. It is calculated by adding up the proportion of total deprivations each person suffers (for example, in Table 2, Person 1 suffers 4 out of 6 deprivations and Person 4 suffers 6 out of 6) and dividing by the total number of poor persons. A = (4/6 + 6/6)/2 = 5/6.
Step 11: Calculate the Adjusted Headcount, M0. If the data are binary or ordinal, multidimensional poverty is measured by the adjusted headcount, M0, which is calculated as H times A. Headcount poverty is multiplied by the ‘average’ number of dimensions in which all poor people are deprived to reflect the breadth of deprivations. In our example, HA = 2/4 × 5/6 = 5/12.
Step 12: Set Weights. Read OPHI’s Working Papers on weighting dimensions of wellbeing and materials from OPHI’s workshop on setting weights in multidimensional measures.
Table 1 Example of application of privation lines, part 1
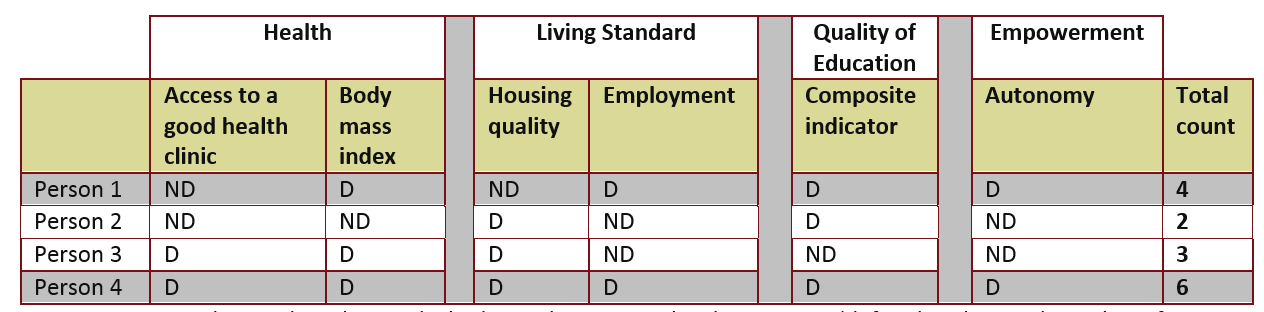
Notes: ND, not deprived; D, deprived. Shading indicates people who are poor (defined as deprived in at least four indicators).
Table 2 Example of application of privation lines, part 2
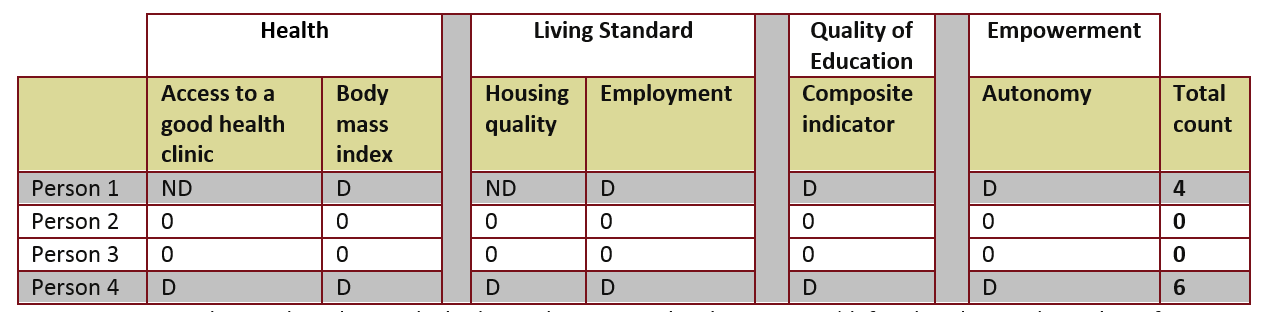
Notes: ND, not deprived; D, deprived. Shading indicates people who are poor (defined as deprived in at least four indicators).
-
Weighting
In constructing multidimensional measures, it is possible to apply weights in aggregating variables (1) within one dimension; (2) across dimensions; and (3) across people.
At each point of aggregation, the parameters that define the marginal contribution of each indicator, dimension, or individual to the overall well-being (or deprivation) need to be determined, taking into consideration also the possible interconnections among them.
OPHI research considers a number of techniques to set weights for multidimensional measures. These include:
- Participatory and expert-based approaches.
- Survey-based methods to elicit directly people’s preferences (standard gamble, visual analogues, and willingness to pay) or making use of subjective-well-being surveys.
- Statistical methods (factor analysis, principal component, latent variable models, and data enveloping analysis).
This work seeks to identify the technical and conceptual strengths and weaknesses of each weighting technique, to clarify which techniques are best suited to set weights in which contexts of multidimensional poverty measurement, and how such weights are to be verified.
In 2008 OPHI held a workshop on weighting in multidimensional measures. For the most up to date products of this workshop, read OPHI Working Papers and Research in Progress papers on this topic. The original materials from the workshop are also available here.
Relevant OPHI Working Papers
- Watson, V., Sutton, M., Dibben, C., and Ryan, M. (2008). ‘Deriving weights for the index of multiple deprivation based on societal preferences: The application of a discrete choice experiment’, OPHI Working Paper 24, University of Oxford.
- Esposito, L. and Chiappero-Martinetti, E. (2008). ‘Restricted and unrestricted hierarchy of weights’, OPHI Working Paper 22, University of Oxford.
- Njong, A.M. and Ningaye, P. (2008). ‘Characterizing weights in the measurement of multidimensional poverty: An application of data-driven approaches to Cameroonian data’, OPHI Working Paper 21, University of Oxford.
-
Robustness
Robustness tests assess the sensitivity of results to different weights within a given technique and across methods.
OPHI is developing techniques to analyse the conditions under which multidimensional welfare or poverty indicators rank social groups consistently, and the degree of sensitivity of these indicators to changes in their key components. These may include the weights attached to dimensions, poverty lines, k-cutoffs, choices of indicators and any sub-indicator, normalisation or aggregation technique.
In 2009 OPHI held a workshop on robustness tests in multidimensional measures. For the most up to date products of this workshop, read OPHI Working Papers and Research in Progress papers on this topic. The original materials from the workshop are also available here.
Relevant OPHI Literature
- Alkire, S., Foster, J. E., Seth, S., Santos, M. E., Roche, J. M., and Ballon, P. (2015). ‘Multidimensional Poverty Measurement and Analysis’, Oxford: Oxford University Press, Chapter. 8 – Robustness Analysis and Statistical Inference.
- Alkire, S. and Santos, M. E. (2013). ‘Measuring acute poverty in the developing world: Robustness and scope of the Multidimensional Poverty Index’, OPHI Working Paper 59, Oxford University.
- Levine, S., Muwonge, J. and Batana, Y. M. (2012). ‘A robust multidimensional poverty profile for Uganda’, OPHI Working Paper 55, University of Oxford.