The global Multidimensional Poverty Index (global MPI) is an annual international measure of acute multidimensional poverty covering over 100 developing countries. It complements traditional monetary poverty measures by capturing the acute, overlapping deprivations in health, education, and living standards that people in poverty face. OPHI computes the global MPI in partnership with the Human Development Report Office of the United Nations Development Programme.
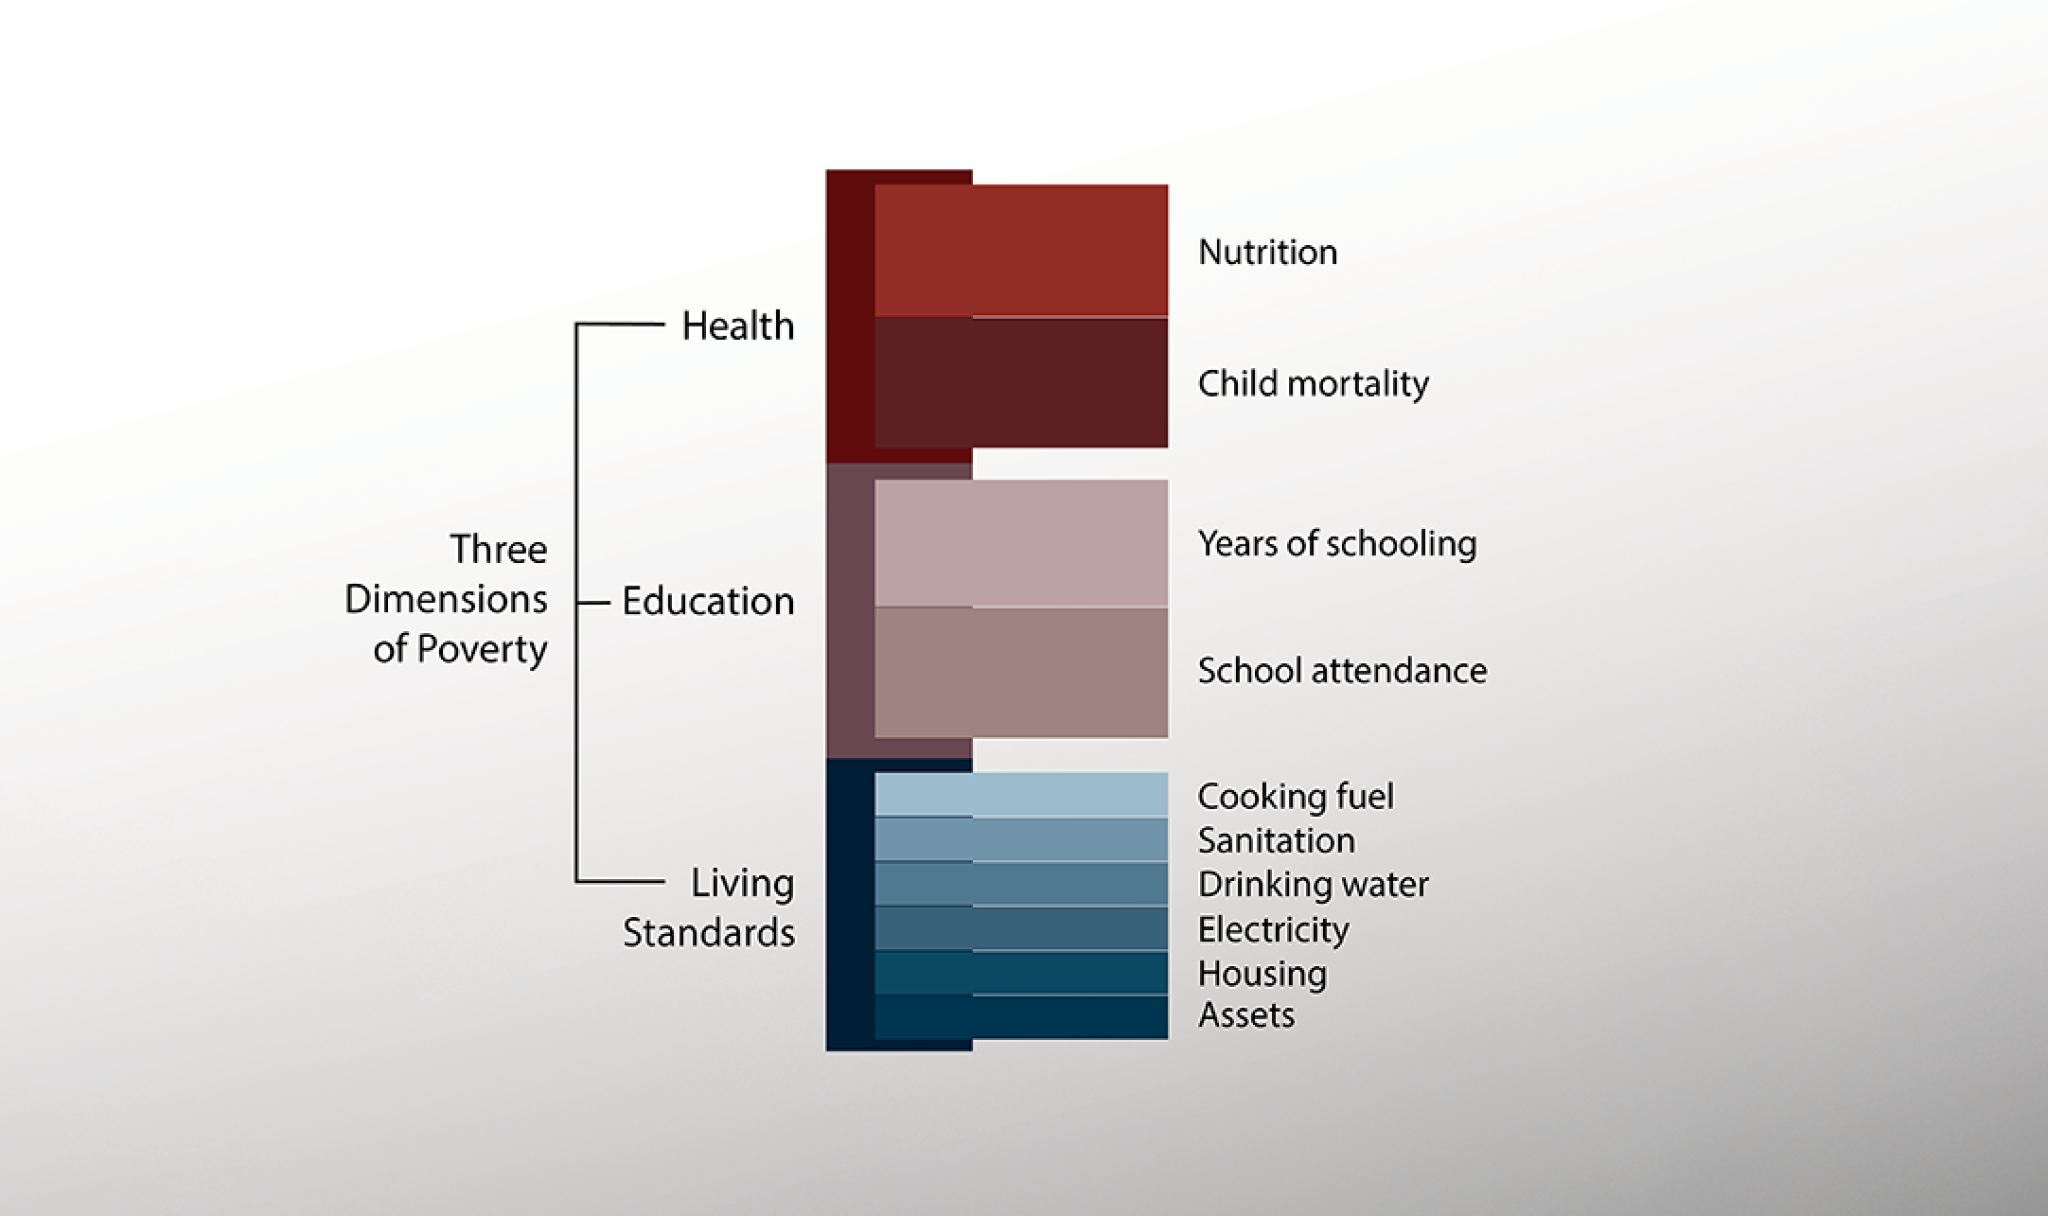
Global MPI diagram
© OPHI 2018